

In today’s digital economy, businesses have access to more data than ever before. Every click, visit, download, and interaction is recorded. Dashboards are filled with numbers, charts, and reports. Yet, despite this abundance of data, many organisations still struggle to achieve consistent revenue growth.
Many companies rely on metrics that look impressive but have little impact on business performance. These are known as vanity metrics. To build a profitable and scalable organisation, businesses must move beyond surface-level numbers and start tracking revenue-driven KPIs that truly matter.
This shift is essential for long-term success.
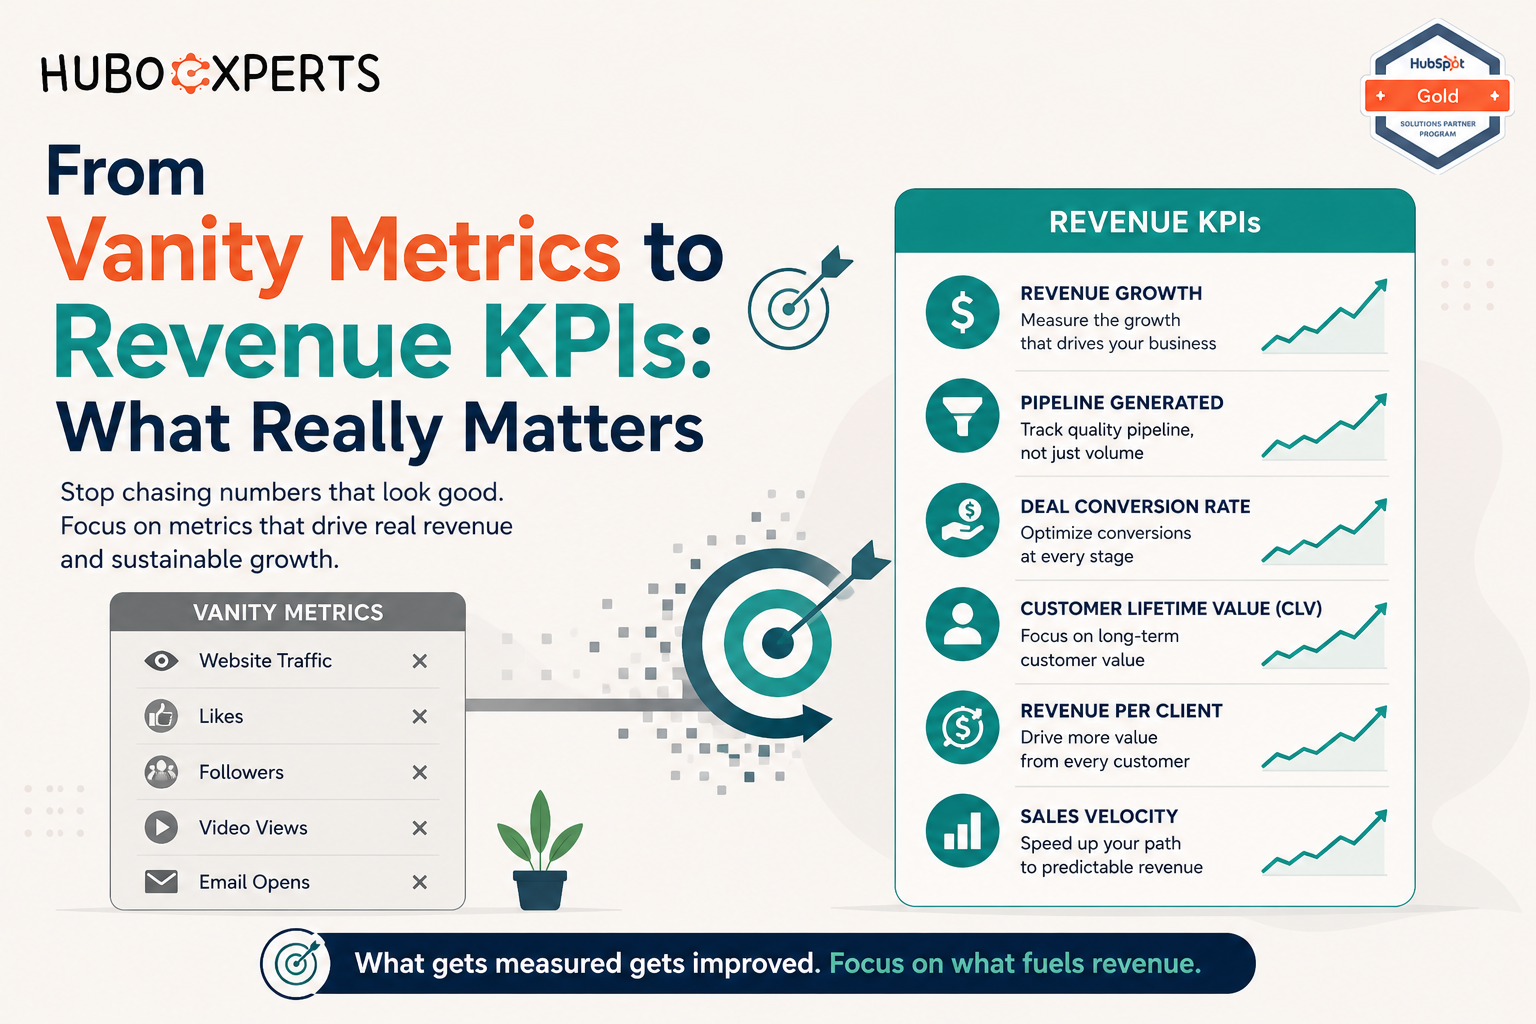
What Are Vanity Metrics?
Vanity metrics are measurements that create the appearance of success without proving real business value. They are easy to track and easy to present, but they rarely explain whether a company is growing profitably.
Common Examples of Vanity Metrics
Some widely used vanity metrics include:
-
Website traffic
-
Social media followers
-
Post likes and shares
-
Email open rates
-
App installs
-
Unqualified form submissions
These numbers are not useless. They can provide useful context. However, they become misleading when they are treated as primary success indicators.
For example, a campaign may generate thousands of website visitors. But if none of those visitors convert into customers, the campaign has delivered visibility, not value.
What Does Click-Through Rate (CTR) Tell You—and How Is It Measured?
Click-through rate, or CTR, measures how effectively your content, ad, email, or call-to-action encourages people to click and take the next step.
A higher CTR usually suggests that your message, offer, or creative is relevant enough to generate interest from your target audience.
CTR is calculated using the following formula:
CTR (%) = (Number of Clicks ÷ Number of Impressions) × 100
For example, if an ad receives 1,000 impressions and generates 50 clicks:
(50 ÷ 1,000) × 100 = 5% CTR
CTR is commonly tracked across paid ads, email campaigns, social media posts, and other digital marketing channels.
It is useful for evaluating the initial effectiveness of your messaging, but it should not be treated as a direct measure of business success. A campaign can generate a strong CTR without producing qualified leads, sales, or revenue.
For this reason, CTR should always be reviewed alongside conversion-focused metrics.
How Engagement Rate Is Calculated
Engagement rate measures how actively your audience interacts with your content.
Instead of looking at likes, comments, or shares individually, engagement rate puts those interactions into context by comparing them with your audience size or reach.
Typical engagement actions may include:
- Likes
- Comments
- Shares
- Saves
- Clicks
- Other platform-specific interactions
A commonly used formula is:
Engagement Rate (%) = (Total Engagements ÷ Total Audience or Reach) × 100
For example, suppose a post receives:
- 200 likes
- 50 comments
- 30 shares
That gives you 280 total engagements.
If the post was measured against an audience of 10,000 people:
(280 ÷ 10,000) × 100 = 2.8% Engagement Rate
Engagement rate provides more context than raw engagement numbers alone because it shows how actively your audience interacts relative to its size.
However, it still does not tell you whether those interactions resulted in leads, customers, or revenue.
Vanity Metrics Are Not Necessarily Useless
Metrics such as impressions, views, likes, followers, and shares are often described as vanity metrics because they can look impressive without proving that a campaign is contributing to business growth.
For example, generating 50,000 website visits sounds positive. But if those visitors do not become qualified leads or customers, the campaign has primarily created visibility rather than measurable business value.
That does not mean vanity metrics should be ignored.
They can still provide useful context when they are connected to more meaningful KPIs.
The key is to treat them as supporting indicators rather than primary measures of success.
The Value of Context: Making Vanity Metrics Useful
Vanity metrics become much more useful when they are analyzed alongside engagement, conversion, revenue, and customer metrics.
Here are several ways they can contribute to a broader performance analysis.
Early Signal Detection
Metrics such as impressions, views, and engagement can provide an early indication of how a campaign is performing.
If a new campaign suddenly receives significantly more impressions or engagement than previous campaigns, it may suggest that the messaging or creative is attracting attention.
This does not guarantee conversions, but it can provide an early signal worth investigating.
Identifying Content Trends
Changes in views, shares, comments, and engagement can help you understand which topics or formats resonate most with your audience.
For example, if educational videos consistently generate more shares than promotional posts, that insight can influence your future content strategy.
The most useful approach is to compare these engagement signals with metrics such as:
-
Click-through rate
-
Leads generated
-
Conversion rate
-
Cost per lead
-
Revenue influenced
This helps determine whether popular content is also contributing to business objectives.
Establishing Benchmarks
When entering a new market, launching a new channel, or testing a different type of content, you may not immediately have enough conversion data to evaluate performance.
In these situations, metrics such as reach, impressions, and engagement can help establish an initial performance baseline.
As more data becomes available, these benchmarks can then be compared with deeper metrics such as lead quality, conversions, and revenue.
Measuring Brand Awareness
For campaigns primarily focused on awareness, surface-level metrics can still provide useful information.
Reach, impressions, branded engagement, and content sharing may help indicate whether more people are becoming familiar with your business.
However, awareness metrics should eventually be connected with deeper outcomes such as:
-
Website engagement
-
Branded searches
-
Lead generation
-
Sales opportunities
-
Customer acquisition
-
Retention
The goal is to understand whether increased visibility is helping move prospects further through the customer journey.
Connect Vanity Metrics with Business KPIs
The strongest marketing analysis combines both surface-level and outcome-focused metrics.
For example:
Impressions → Clicks → Website Visits → Leads → Qualified Leads → Opportunities → Customers → Revenue
This creates a much clearer picture of campaign performance.
Instead of asking:
“How many people saw our campaign?”
You can ask:
“How many people saw our campaign, engaged with it, became qualified leads, and eventually converted into customers?”
That shift turns reporting from a collection of impressive numbers into something that can support real business decisions.
Understanding Conversion Rate in Social Media
Among performance-focused marketing KPIs, conversion rate is particularly important because it measures whether users are completing the action your campaign is designed to generate.
A conversion might include:
-
Making a purchase
-
Booking a consultation
-
Requesting a demo
-
Submitting a lead form
-
Signing up for a newsletter
-
Downloading a resource
-
Registering for an event
The exact conversion depends on the objective of your campaign.
How to Calculate Conversion Rate
The basic formula is:
Conversion Rate (%) = (Number of Conversions ÷ Number of Visitors or Clicks) × 100
For example, if a social media campaign generates 1,000 website visits and 50 people complete your desired action:
(50 ÷ 1,000) × 100 = 5% Conversion Rate
The denominator you use should remain consistent with what you are trying to measure. Some businesses calculate conversion rate based on clicks, while others use landing page sessions or website visitors.
Why Conversion Rate Matters
Conversion rate helps answer a question that metrics such as impressions and clicks cannot:
Are people actually taking the action we want them to take?
A campaign could have:
-
High impressions
-
Strong engagement
-
Excellent CTR
and still produce very few conversions.
This may indicate issues with:
-
Landing page experience
-
Audience targeting
-
Offer relevance
-
Form length
-
Pricing
-
Messaging consistency
-
Conversion tracking
By monitoring conversion rate alongside CTR and engagement rate, you can see whether users are simply interacting with your content or actually progressing toward becoming customers.
Look at the Complete Journey
No single metric provides the full picture.
The most useful analysis connects multiple stages of the customer journey:
Reach → Engagement → Clicks → Conversions → Qualified Leads → Customers → Revenue
CTR tells you whether people are interested enough to click.
Engagement rate tells you whether your content is generating interaction.
Conversion rate tells you whether people are completing your desired action.
Revenue and customer acquisition metrics tell you whether those actions are creating meaningful business results.
When these metrics are analyzed together, your reporting becomes far more useful than simply tracking whichever number looks best on a dashboard.
Why Businesses Rely on Vanity Metrics
Many organisations continue to focus on vanity metrics for practical and psychological reasons.
-
Easy Availability
Most marketing and analytics tools display these numbers by default. They are instantly visible and require no advanced setup.
-
Quick Reporting
Vanity metrics are simple to include in reports and presentations. Large numbers often impress stakeholders.
-
Emotional Satisfaction
Seeing growth in likes or followers feels motivating, even if revenue remains unchanged.
-
Lack of Accountability
Since these metrics are not directly tied to financial performance, they allow teams to avoid difficult ROI discussions.
Over time, this creates a culture where activity is celebrated more than outcomes.
What Are Revenue KPIs?
Revenue KPIs are performance indicators that directly connect business activities to income. They show how effectively a company converts marketing and sales efforts into measurable financial results.
Unlike vanity metrics, revenue KPIs answer critical questions:
-
How much revenue is being generated?
-
Which channels produce profitable customers?
-
How efficient is our sales process?
-
What is the cost of growth?
-
How predictable is future income?
These insights allow leaders to make informed strategic decisions.
Key Revenue KPIs That Drive Real Growth
Below are the most important revenue-focused KPIs that successful businesses track.
1. Customer Acquisition Cost (CAC)
Customer Acquisition Cost measures how much it costs to acquire one paying customer.
It includes marketing spend, sales expenses, tools, and manpower.
Why it matters:
If acquisition costs are too high, growth becomes unsustainable. Even strong revenue can collapse under inefficient spending.
Calculating Customer Acquisition Cost (CAC) from Social Media Campaigns
Customer Acquisition Cost, or CAC, helps you understand how much your business is spending to acquire each new customer through social media.
To calculate CAC accurately, start by adding up all costs associated with your social media campaigns. This may include:
-
Paid advertising spend
-
Content creation costs
-
Boosted posts
-
Agency or freelancer fees
-
Software or campaign management costs
-
Internal team or labor costs
Next, determine how many paying customers were generated directly from those campaigns. Tracking tools such as Google Analytics, Meta Pixel, CRM attribution, and UTM parameters can help connect social media interactions with conversions.
Use the following formula:
CAC = Total Social Media Campaign Cost ÷ Number of Customers Acquired
For example, if you spend $5,000 on social media campaigns and acquire 50 new customers, your CAC would be:
$5,000 ÷ 50 = $100 CAC
Tracking CAC over time helps you understand whether your campaigns are producing profitable customer growth or simply generating clicks and engagement without meaningful revenue.
If CAC begins to rise while conversions remain flat, it may indicate that you need to improve your targeting, messaging, landing pages, offer, or budget allocation.
A sustainable CAC is especially important when compared with metrics such as Customer Lifetime Value (CLV), because acquiring customers profitably is ultimately more important than simply generating more traffic or engagement.
2. Customer Lifetime Value (LTV)
Customer Lifetime Value estimates how much revenue a customer generates throughout their relationship with your company.
Why it matters:
High LTV allows businesses to invest confidently in customer acquisition and retention.
A healthy LTV compared to CAC indicates strong profitability.
3. Lead Qualification Conversion Rate
This KPI measures how many leads progress from initial inquiry to sales-qualified opportunity.
Why it matters:
High lead volume with low qualification indicates weak targeting or poor nurturing.
Quality matters more than quantity.
4. Lead-to-Customer Conversion Rate
This metric shows how effectively leads are converted into paying customers.
Why it matters:
It reflects the combined performance of marketing, sales, and customer experience.
Low conversion indicates friction in the funnel.
5. Sales Pipeline Value
Pipeline value represents the total potential revenue in active opportunities.
Why it matters:
It helps forecast revenue and identify shortfalls early.
A weak pipeline signals future risk.
6. Sales Cycle Length
This measures the average time required to close a deal.
Why it matters:
Long sales cycles increase costs and delay cash flow.
Optimising cycle length improves operational efficiency.
7. Revenue by Channel
This KPI tracks how much revenue is generated from each acquisition channel.
Why it matters:
It reveals which platforms actually drive profit and which only generate traffic.
This guides budget allocation.
8. Customer Retention and Churn
Retention measures how many customers stay.
Churn measures how many leave.
Why it matters:
Retaining existing customers is often more cost-effective than acquiring new ones.
High churn weakens long-term growth.
The Role of CRM in Revenue Measurement
Modern CRM platforms allow businesses to track the entire customer journey, from first interaction to long-term retention.
When configured correctly, a CRM can:
-
Connect campaigns to closed deals
-
Measure funnel performance
-
Track customer behaviour
-
Attribute revenue accurately
-
Enable predictive forecasting
However, many organisations underutilise these capabilities due to poor implementation or unclear strategy.
Common Reporting Challenges We See
Through our consulting experience, we frequently observe the following issues:
-
Disconnected Systems
Marketing, sales, and finance operate in isolation, resulting in incomplete reporting.
-
Overloaded Dashboards
Dashboards contain too many metrics without clear priorities.
-
Missing Attribution
Revenue is not linked to specific campaigns or channels.
-
Inconsistent Definitions
Different teams use different standards for leads and opportunities.
-
Lack of Review
Reports are created once and never refined.
These gaps prevent leadership from gaining actionable insights.
How to Build a Revenue-Driven KPI Framework
At HuboExperts, we follow a structured methodology to ensure reliable reporting.
Step 1: Clarify Business Objectives
Every KPI must support a clear business goal, such as:
-
Revenue growth
-
Market expansion
-
Profitability
-
Customer retention
Metrics without purpose create confusion.
To avoid tracking data points that look impressive but provide little real business value—often referred to as vanity metrics—focus on KPIs that support meaningful decisions and measurable outcomes.
Metrics such as social media likes, impressions, or raw website traffic can be useful for understanding visibility, but on their own, they do not always indicate business growth. The key is to connect these numbers with outcomes such as lead generation, conversion rates, revenue, customer retention, and engagement quality.
Start by identifying the campaigns and initiatives that directly support your business objectives. Then, evaluate performance in context by combining top-level metrics with deeper conversion and engagement data.
It is also important to align KPIs across departments. Marketing, sales, and customer service teams should work from a shared set of performance indicators that reflect the overall health of the customer journey.
By defining clear, actionable KPIs from the beginning, your teams can stay focused on what truly matters, make better decisions, and measure progress against meaningful business goals.
Step 2: Map the Customer Journey
Document every stage from awareness to retention.
Each stage requires specific performance indicators.
This ensures full-funnel visibility.
Step 3: Align Marketing and Sales
Both teams must agree on:
-
Lead qualification rules
-
Handover processes
-
Success criteria
Alignment prevents data conflict.
Step 4: Configure CRM Infrastructure
We implement:
-
Lifecycle stages
-
Custom properties
-
Pipeline structures
-
Automation workflows
-
Data validation rules
This ensures data accuracy.
Step 5: Design Role-Based Dashboards
Different stakeholders need different views.
Executives, managers, sales teams, and marketers all require tailored dashboards.
One-size-fits-all reporting rarely works.
Step 6: Review and Optimise Regularly
KPIs must evolve with business strategy, market changes, and customer behaviour.
Regular reviews maintain relevance.
Business Benefits of Revenue-Focused Measurement
Companies that prioritise revenue KPIs experience:
-
Better forecasting accuracy
-
Improved ROI
-
Stronger accountability
-
Faster decision-making
-
Higher operational efficiency
-
Predictable scaling
Most importantly, leadership gains confidence in strategic planning.
Why HuboExperts Focuses on Revenue Intelligence
At HuboExperts, we believe that CRM systems should do more than store contacts.
They should enable growth.
We help businesses:
-
Build revenue-driven dashboards
-
Implement advanced reporting frameworks
-
Improve pipeline management
-
Optimise lead qualification
-
Strengthen attribution models
-
Enhance forecasting accuracy
Our approach transforms CRMs into decision-making engines.
Conclusion: Measure What Truly Matters
Vanity metrics may create temporary motivation, but they do not build sustainable businesses.
Revenue KPIs reveal reality.
They show what works, what fails, and where improvement is needed. They connect daily activity with long-term success.
If your reports still focus mainly on traffic, likes, and impressions, it is time to rethink your measurement strategy.
Growth begins with clarity.

